A DEXA scan measures your body composition and bone health with precision. Here's what it reveals:
This scan offers detailed insights to guide fitness, nutrition, and health strategies. It’s quick, painless, and more accurate than most other methods.
DEXA Scan Body Composition and Bone Health Metrics Guide
Understanding how a DEXA scan vs. body fat scale compare in accuracy is essential for choosing the right tracking method.
A DEXA scan provides detailed measurements of your fat mass, lean muscle mass, and bone density, with a precision margin of ±0.8% to 1% body fat for repeat scans. It also offers insights into regional fat and muscle distribution, helping you create a more tailored health plan.
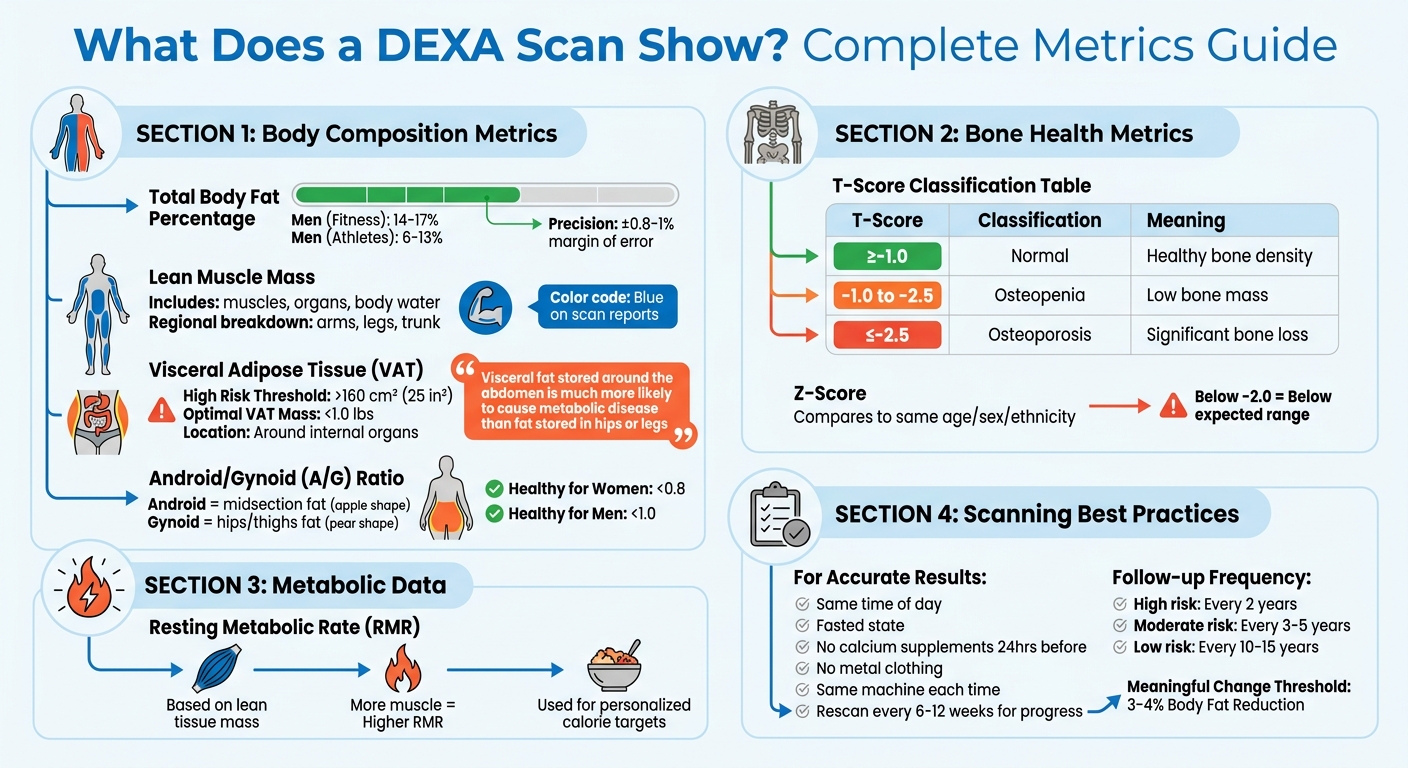
Total Body Fat Percentage (%BF) reveals the proportion of your body made up of fat and identifies where that fat is stored. For example, men in the "fitness" category typically have body fat between 14% and 17%, while athletes generally range from 6% to 13%.
Lean Muscle Mass includes everything in your body except fat and bone - such as muscles, organs, and body water. Regional data can pinpoint muscle imbalances between limbs or early signs of sarcopenia (age-related muscle loss). This is particularly helpful for tracking whether your training is building muscle evenly.
Visceral Adipose Tissue (VAT) refers to fat stored around your internal organs in the abdominal cavity.
"Visceral fat - which is fat that is stored around the abdomen - is much more likely to cause metabolic disease than fat that is stored in the hips or legs." - Dr. Daniel Ghiyam from MedPodLA
A VAT area exceeding 160 cm² (about 25 in²) is associated with a higher risk of cardiovascular and metabolic conditions.
The Android to Gynoid (A/G) Ratio compares fat in the midsection (android) to fat in the hips and thighs (gynoid). A higher android fat distribution is linked to greater cardiometabolic risks. This explains why two people with the same overall body fat percentage can face very different health outcomes.
DEXA scans also measure Bone Mineral Density (BMD) and provide a T-score, which compares your bone density to that of a healthy individual in their 20s or 30s. These scores help assess risks for conditions like osteopenia and osteoporosis.
Some reports include a Z-score, which compares your bone density to others of the same age, sex, and ethnicity. This is particularly helpful for younger individuals who want to see how their bone health stacks up against their peers.
In addition to structural data, DEXA scans can estimate your body's energy requirements.
DEXA scans often include an estimate of your Resting Metabolic Rate (RMR), based on the composition of your tissues. This value reflects the "ideal" RMR for your body size and composition. Since lean muscle mass is a key driver of RMR, gaining muscle can increase your resting energy expenditure.
"When you combine the data from a DEXA scan with RMR testing, you can correlate how much lean mass you have with how much energy your body needs. This gives you personalized metabolic clarity, rather than relying on averages or assumptions." - DEXA SCAN NEAR ME
This estimate helps you set accurate calorie targets for weight management or muscle building. If a follow-up scan shows an increase in lean mass, you can adjust your nutrition to meet the higher energy demands.
Your DEXA scan report is packed with valuable data about your body composition and bone health. By breaking down the key measurements, you can better understand how they relate to your fitness, nutrition, and overall well-being.
One of the main highlights of a DEXA scan is its ability to measure your total body fat percentage. This is calculated by dividing your total fat mass by your total body mass and multiplying by 100. Since DEXA scans analyze every fat cell in your body, the results are often higher than those from methods like bioelectrical impedance or skinfold calipers.
The scan also reveals how fat is distributed in your body, focusing on two key areas: android fat and gynoid fat. Android fat collects around your midsection (think "apple shape") and is linked to a higher risk of heart and metabolic issues. On the other hand, gynoid fat tends to settle in the hips and thighs (a "pear shape") and is generally considered less risky. After reviewing fat distribution, it’s time to dive into your lean muscle data for a clearer picture of your body composition.
Lean mass includes everything in your body that isn’t fat or bone. Your DEXA scan will break this down regionally, showing lean mass in pounds for your arms, legs, and trunk (the area from your neck to your hips). On your report, lean tissue is usually marked in blue.
Tracking lean mass can help you see if weight loss is coming from fat rather than muscle. Ideally, during body recomposition, fat mass decreases while lean mass stays the same or increases. If both are dropping, it might be time to tweak your workout or nutrition plan. DEXA’s regional data also highlights muscle imbalances between limbs - something that sets it apart from other methods of body composition analysis. Once you’ve reviewed your lean mass, the next step is understanding your bone health.
Bone density is a critical part of your DEXA scan results, measured through two scores: the T-score and, in some cases, the Z-score.
Here’s a quick guide to T-scores:
| T-Score Range | Classification | Clinical Meaning |
|---|---|---|
| -1.0 or higher | Normal | Bone density is within the healthy range for a young adult |
| -1.0 to -2.5 | Osteopenia | Indicates low bone mass, which increases the risk of osteoporosis |
| -2.5 or lower | Osteoporosis | Reflects significant bone loss and a higher risk of fractures |
"A T-score ≥ –1.0 is considered normal, between –1.0 and –2.5 indicates low bone mass (osteopenia), and ≤ –2.5 indicates osteoporosis." - Sean Selters, Body Fat USA
For younger individuals, such as premenopausal women and men under 50, a Z-score below -2.0 is classified as "below the expected range for age." If your results show low bone density, it’s a good idea to follow up with a focused spine and hip scan. These scans are considered the gold standard for diagnosing bone health issues and assessing fracture risk.
Getting a DEXA scan is just the beginning. The true benefit lies in using the results to refine your training, nutrition, and overall health approach.
Regular scans can show you if your health strategies are delivering results. If you’re tweaking your workouts or diet, consider rescanning every 6–12 weeks to monitor progress. For consistency, follow these preparation tips: schedule your scan at the same time of day, in a fasted state, avoid calcium supplements for 24 hours beforehand, wear clothing without metal, and stick to the same machine whenever possible (different calibrations can lead to up to 5% variation in fat measurements). A decrease of around 3% to 4% in total body fat is generally considered a meaningful change beyond the scan’s margin of error.
Use these insights to fine-tune your training and nutrition for better results.
Your DEXA scan results can guide a personalized fitness and nutrition plan. Start by analyzing your regional lean mass data. If you notice muscle imbalances, adjust your strength training routine - aim for 2–4 sessions per week - to target weaker areas. Addressing these imbalances can also lower your risk of injury.
Pay special attention to your Android-to-Gynoid (A/G) ratio and Visceral Adipose Tissue (VAT) levels. These metrics are more effective at identifying metabolic risk than total body fat percentage. Healthy A/G ratios are below 0.8 for women and under 1.0 for men, while optimal VAT mass should remain below 1.0 lbs. Elevated readings in these areas may signal an increased risk of cardiovascular disease and diabetes, suggesting that reducing abdominal fat should be a priority through dietary changes.
For a more precise nutrition strategy, combine your DEXA results with a Resting Metabolic Rate (RMR) test. This approach allows you to calculate caloric needs based on your lean tissue mass instead of generic formulas. If your scan shows both fat and lean mass decreasing during a fat-loss phase, it’s time to increase your protein intake and review your recovery routines. During body recomposition, the goal is to reduce fat mass while maintaining or increasing lean mass.
Once you’ve addressed muscle and fat distribution, you can shift your focus to bone health.
If your T-score indicates osteopenia (–1.0 to –2.5) or osteoporosis (below –2.5), it’s crucial to focus on bone strength. Incorporate weight-bearing activities like walking, jogging, or stair climbing into your routine, and ensure your diet is rich in calcium. If necessary, talk to your healthcare provider about hormone therapy to counteract declining bone density. The frequency of follow-up scans depends on your risk level: every 2 years for high risk, every 3–5 years for moderate risk, and every 10–15 years for low risk.
"In a longevity medicine framework, a DEXA scan is not just a screening test. It is a way to understand how your body is structured today, how it is changing over time, and where risk may already be developing beneath the surface." - Dr. Kathryn Retzler, Founder, HormoneSynergy
A DEXA scan offers a detailed look at your body composition, going far beyond what a standard scale can tell you. It breaks down your body into fat mass, lean mass, and bone mineral content, providing what many consider a "gold standard" snapshot of your overall health. This level of detail can highlight critical health indicators - like excess visceral fat, which is linked to type 2 diabetes and heart disease, or decreasing bone density, which raises the risk of fractures.
What makes DEXA scan data so powerful is how it turns raw numbers into actionable health plans. With a margin of error as low as ±0.8% to 1%, trainers, nutritionists, and doctors can use this information to differentiate between fat loss and muscle gain, allowing for truly personalized strategies.
Regular scans take the guesswork out of tracking progress. If you're actively working on body composition, scheduling a re-scan every 6–12 weeks can help you stay on track. For monitoring bone health, high-risk individuals may need scans every 2 years, while routine checks might only be necessary every 10–15 years. These periodic assessments ensure your health plan evolves with your needs.
For the most accurate results, stick to the same machine, scan at the same time of day, and follow the same preparation steps each time. Working closely with healthcare professionals can further fine-tune your approach. With this data-driven method, you can take control of your health and work toward a longer, healthier life.
Getting ready for a DEXA scan is simple, but a few steps can help ensure accurate results:
Following these guidelines will make the process smoother and more reliable.
It’s typically suggested to schedule a DEXA scan every 1–2 years if you want to track changes in body composition, though this can vary based on your health goals and personal risk factors. For evaluating bone health, a scan every 3–5 years is often recommended. Be sure to discuss with your healthcare provider to figure out the right timing for your situation.
If your T-score reveals osteopenia or osteoporosis, it’s essential to talk to your healthcare provider. They might recommend a combination of medication, lifestyle changes, and fall prevention strategies. While these conditions can’t be reversed, they are manageable, making early intervention crucial for protecting your bone health and lowering potential risks.
