Your resting metabolic rate is driven more by what your body is made of than by what you weigh. If I had to boil the article down to a few lines, it’s this: fat-free mass is the main driver of RMR, organs use a lot of energy even though they’re small, and prediction formulas can be far off if they ignore body composition.
Here’s the short version:
What I take from the research is simple: if you want a better read on calorie needs, weight-loss stalls, or body changes, don’t stop at body weight. Look at lean mass, fat mass, visceral fat, fitness, and measured RMR together.
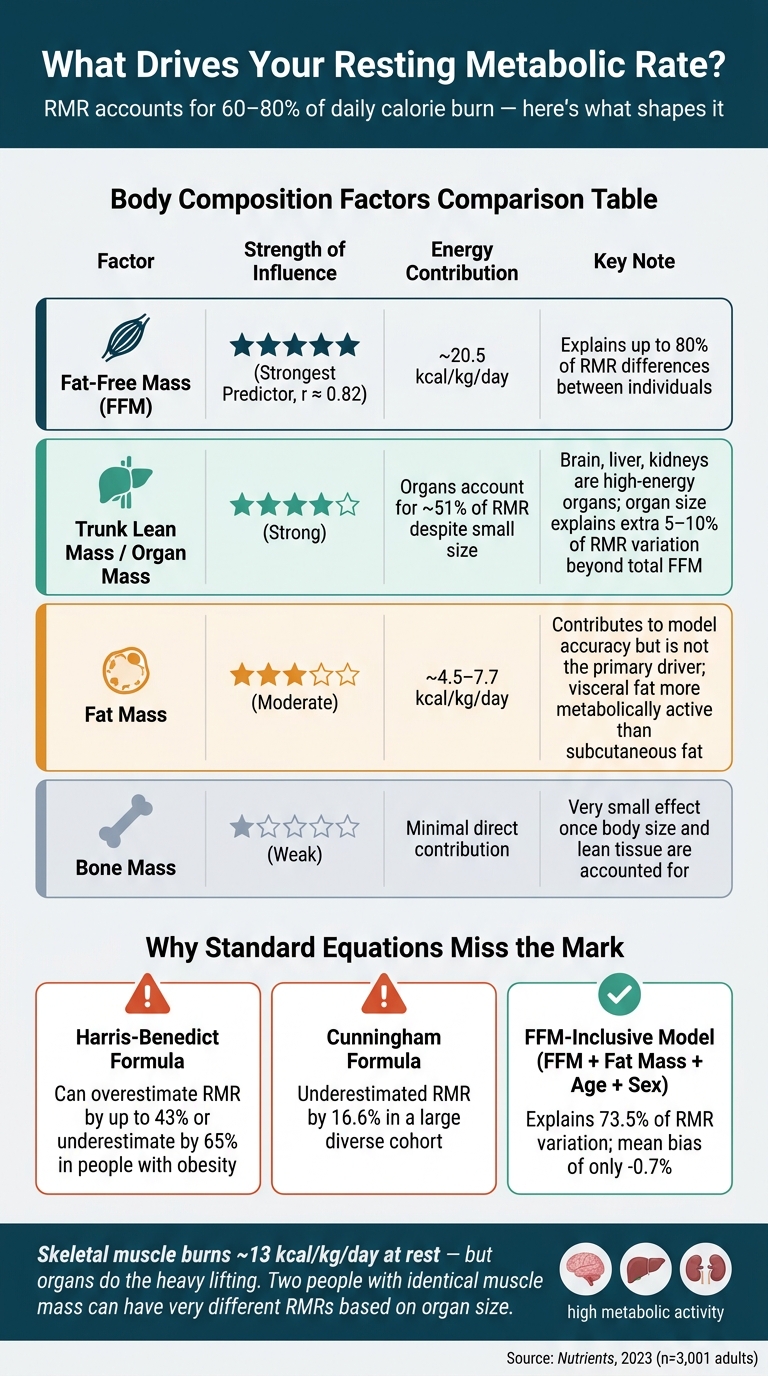
Body Composition Factors That Drive Resting Metabolic Rate (RMR)
The clearest data comes from studies using various body composition testing methods to measure this directly. A 2023 Nutrients study looked at 3,001 adults ages 20–95 and found that FFM was the strongest predictor of RMR. In that study, FFM had the strongest link with RMR (r = 0.824), ahead of both body weight and height. And when researchers built a model using FFM, fat mass, age, and sex, it explained 73.5% of the variation in RMR - more than standard equations on their own.
Skeletal muscle makes up a big share of FFM, but at rest it burns only about 13 kcal per kilogram per day. So while muscle matters, it isn't the whole picture.
A lot of resting energy use comes from small organs that work hard all day. The brain, liver, and kidneys do most of the heavy lifting here. Even though they don't weigh much, together they account for about 51% of RMR in an average adult. MRI and CT studies add another layer: organ mass explains an extra 5% to 10% of RMR variation beyond total FFM.
Put another way, FFM as a whole contributes about 20.5 kcal per kilogram per day - almost three times as much as fat mass. That's also why trunk lean mass tracks closely with RMR. Two people can have the same total muscle mass and still end up with meaningfully different RMRs if their organ sizes differ—a nuance often missed when comparing DEXA scans and body fat scales. So total lean mass helps a lot, but it doesn't tell the whole story.
Bone plays a much smaller part in resting calorie burn. Once total body size and lean tissue are taken into account, bone mass is only a weak predictor of RMR. For readers watching metabolic health, the main things to watch are lean soft tissue and organ mass.
Here's how the main body-composition factors stack up:
Fat-free mass explains most of resting metabolic rate, or RMR. But it doesn't explain everything. Where fat is stored and how fit someone is help fill in the rest.
Fat mass does add to RMR, but not by much when compared with fat-free mass. Bigger bodies tend to burn more calories at rest. Still, most of that gap comes from lean tissue, not body fat.
Total fat mass and visceral fat are different, and studies look at them in different ways. In a 2024 study of 53 patients with overweight or obesity, total fat mass no longer had its own link to RMR once muscle mass, age, and sex were taken into account. That matters because it shifts the focus away from total body fat alone and toward where that fat sits.
Unlike subcutaneous fat, which sits just under the skin, visceral fat surrounds the organs. It has more blood flow and more metabolic activity. That helps explain why visceral fat may affect RMR more than total fat mass does.
That said, this is not a health perk. Visceral fat points to poorer metabolic health, not some kind of upside.
Fitness adds another layer. Cardiorespiratory fitness and strength both play a part. Higher fitness levels are tied to RMR patterns that line up more closely with fat-free mass, and strength training affects RMR mostly by adding skeletal muscle, which burns more energy at rest than fat tissue.
So yes, a person with a larger body may have a higher absolute RMR. But that doesn't automatically mean better metabolic health. Those are not the same thing.
Pairing resistance training with cardiorespiratory fitness - something you can measure with a VO2 max test - tends to produce a better metabolic pattern: more lean mass, less visceral fat, and a resting calorie burn driven more by tissue that is doing active work.
These patterns are easier to compare side by side:
| Body Composition Pattern | Typical RMR Profile | VO2 max Profile (prepare for your test) | Visceral Fat Pattern | Practical Interpretation |
|---|---|---|---|---|
| Higher fat mass with lower fitness | Higher absolute RMR due to larger body size | Lower | Often higher | Higher absolute RMR, but driven mostly by body size. |
| Moderate fat mass with higher fitness | Moderate to high RMR | Higher | Often lower | Better metabolic health despite not the highest absolute RMR. |
| Higher lean mass with higher fitness | Highest absolute RMR | Higher | Usually lowest | RMR driven by metabolically active lean tissue. |
Even after researchers account for body composition, age, sex, and race still affect RMR.
Age has a clear effect. RMR drops by about 1% to 2% per decade from ages 20 to 75, or about 5 kcal/day per year in a 3,001-person study. And this drop isn't just about losing muscle over time. Even when fat-free mass stays the same, older adults still tend to have a lower RMR. That points to changes in how cells use energy, not only changes in tissue amount.
Across both sexes and across age groups, fat-free mass is still the strongest predictor of RMR. Fat mass also plays a bigger role in older adults.
Sex differences follow a similar pattern. Men usually show a higher RMR, about 9% higher than women when other variables are held constant. But once fat-free mass is taken into account, most of that gap shrinks or disappears. In plain English: much of the difference comes down to body composition, not sex by itself.
Race makes the picture a bit more complicated. Some studies found lower measured RMR in certain groups, including Black women, even after adjusting for fat-free mass, fat mass, age, and sex. Researchers still don't know the exact cause. One proposed reason is differences in organ mass distribution. That's a big reason direct measurement tends to beat prediction equations.
This is where formula-based estimates often run into trouble.
Weight-based equations treat body weight too broadly. But not all weight uses energy the same way at rest. A kilogram of fat-free mass uses far more energy than a kilogram of fat mass - about 13 kcal/kg/day versus 4.5 kcal/kg/day.
There's another issue: many of these equations were built from fairly narrow study groups. They don't always reflect the full mix of body sizes, ages, and backgrounds seen in the general population now. So when you use them in day-to-day settings, the miss can be large.
For example:
When researchers built a prediction model that included fat-free mass, fat mass, age, and sex, the share of explained variation in RMR climbed to 73.5%, and the mean bias narrowed to just -0.7%. That's a clear step up from weight-based formulas.
So the pattern is pretty straightforward: age tends to lower RMR, men often have a higher RMR largely because they carry more fat-free mass, and some race-related differences remain even after adjustment.
Measured RMR does the best job of separating tissue-related differences from the guesswork built into equations.
Scale weight is a rough tool. It doesn't tell you much about metabolism on its own, because fat-free mass, fat mass, and organ size have a much closer link to RMR. So if you want a clearer view of what's going on, track the measures that shape RMR in the first place.
Focus on:
Each one tells you something useful about resting metabolism or how well your body uses energy.
For testing, use indirect calorimetry to measure RMR and DEXA to measure body composition. Equations can help with rough planning, but they're not the same as direct testing. In some cases, they can misestimate RMR by 2.1% to 16.6%.
Once you have a baseline, repeat testing helps you see if your diet and training are moving things in the right direction. If you're making active changes to your routine, retesting every 3 to 6 months is usually enough time to spot real changes while also catching lean-mass loss during a calorie deficit.
Benchmark Body Metrics offers DEXA, indirect calorimetry, and VO2 max testing to track changes over time.
These measurements aren't just numbers on a report. They help shape calorie intake, training plans, and long-term health checks.
Lean mass should be protected and built whenever possible. Resistance training is the strongest lever for supporting resting metabolism, so it deserves a central place in the plan.
Calorie restriction also needs care. If you cut too hard, you can run into metabolic adaptation - a bigger-than-expected drop in RMR during aggressive dieting. That can slow progress and increase hunger over time. When you need a personal calorie target, measured RMR gives you a better starting point than an equation.
Visceral fat matters for another reason: it tracks central obesity and higher metabolic risk. A person can keep the same body weight while visceral fat climbs, and that shift may point to a worse risk profile that the scale simply misses.
Age and sex affect RMR, but demographic averages only tell part of the story. Direct measurement helps close the gap between a general estimate and your actual calorie needs.
Lean mass has a bigger effect on resting metabolic rate because it includes tissues and organs that use energy and produce heat even when you're not moving. Total body weight is less exact since it lumps together lean mass and fat mass, and fat tissue burns fewer calories at rest.
Research suggests that muscle contributes about 13 kcal per day per kilogram, while fat mass contributes about 4.5 kcal per day per kilogram.
Yes. Two people can weigh the same and still have very different resting metabolic rates. That’s because RMR depends more on body composition than on body weight alone.
Fat-free mass - including muscle - burns more energy at rest than fat mass. So if one person has more muscle and less fat, their RMR will often be higher, even if the scale shows the same number.
Age, sex, activity level, and muscle-to-fat ratio also play a part. Put simply, the number on the scale doesn’t tell the whole story.
Retest your resting metabolic rate and body composition on a regular basis so you can see what’s changing and adjust your eating or training plan as your body changes.
A common follow-up schedule is every 3 to 6 months. In many cases, body composition changes start to show up after 6 to 12 weeks. Retesting also makes sense after clear shifts in muscle mass or fat mass.


.svg)
